17 KiB
Centralized System Monitoring
When you have multiple servers or client computers under your control it's nice to have a centralized way of monitoring them for health or unexpected errors. There are a few different solutions out there but we'll have a go at installing and configuring munin.
Munin
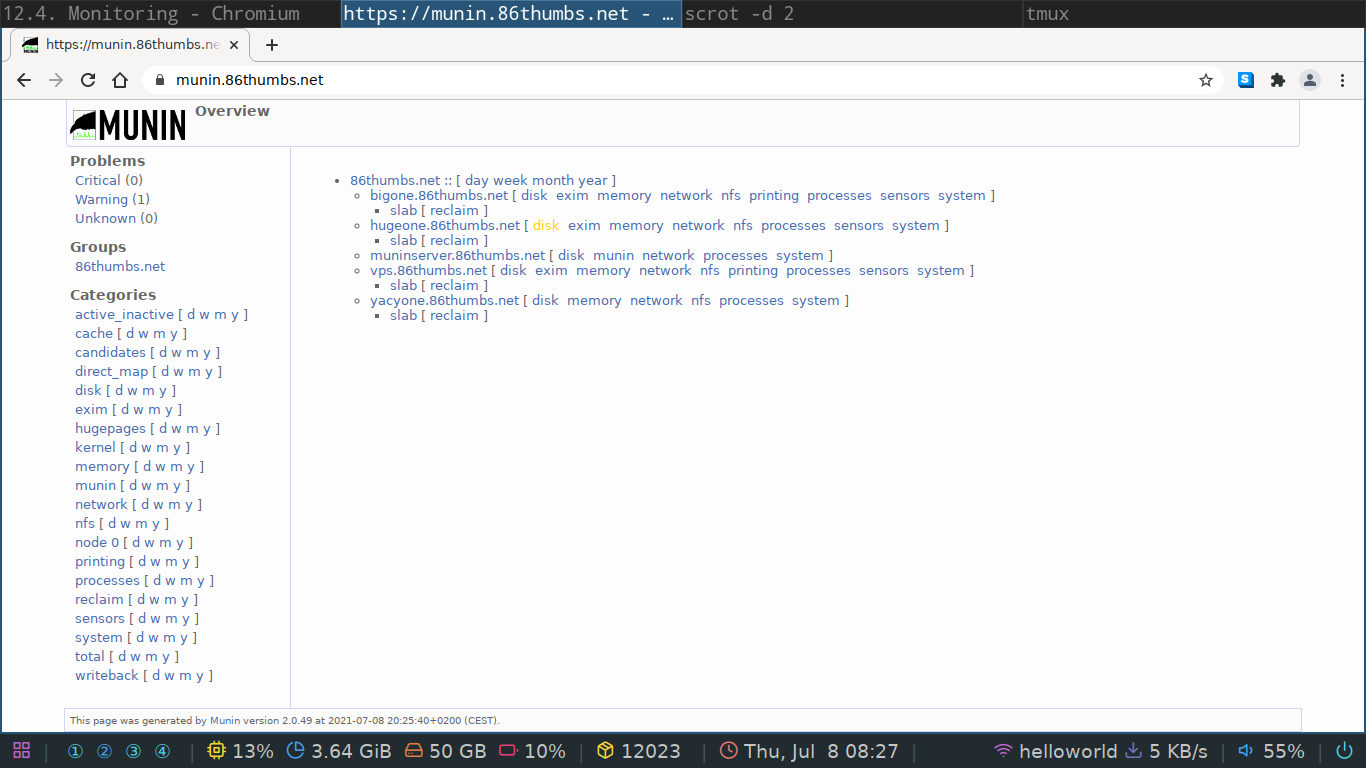
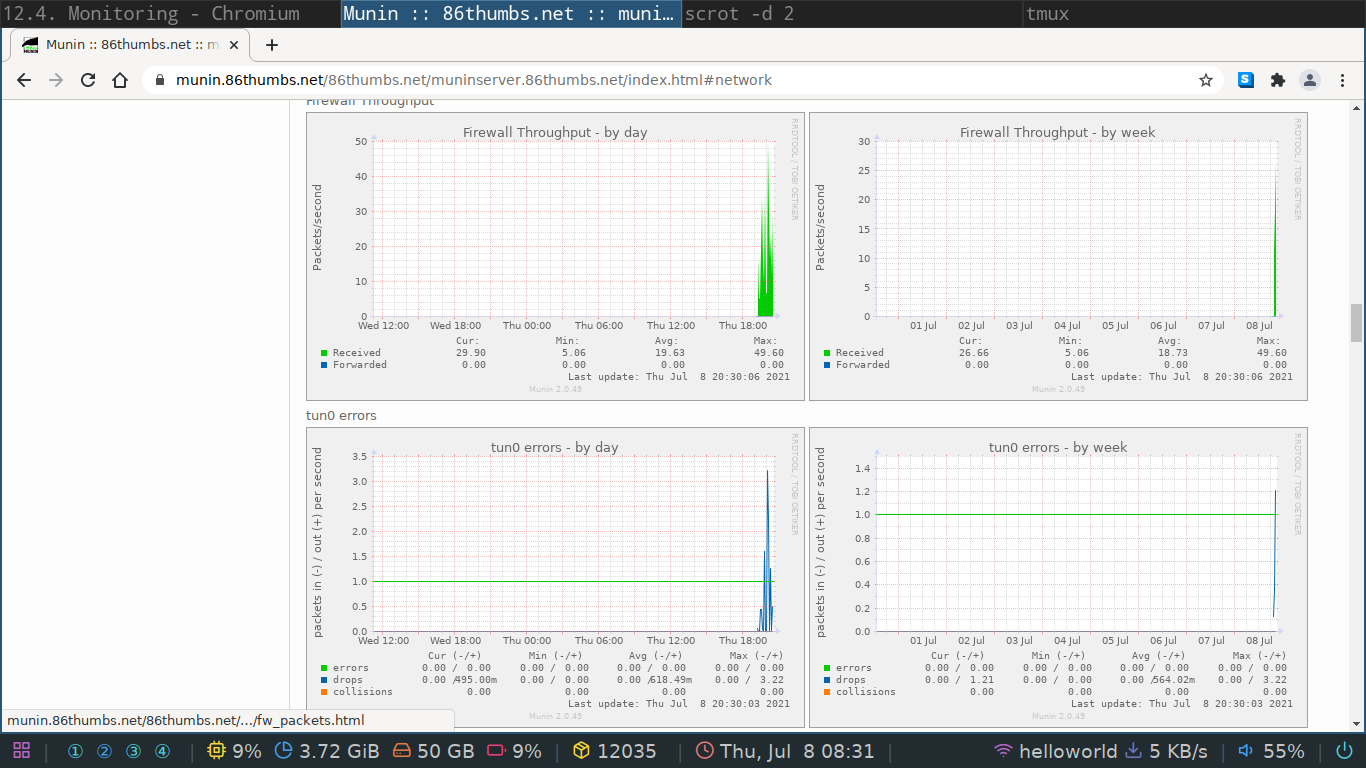
I set one up on this domain for demonstration purposes. You can log in with the account details I'll hand out in class.
Architecture
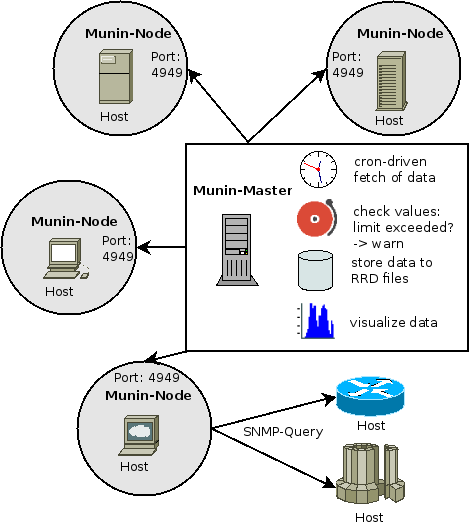
Munin has a server client architecture where they refer to the server as master and the clients as nodes. When monitoring for example ten workstations or servers you will have one master and on each workstation or server you'll install one node but in total you'll have ten nodes connected to your single master.
The master
First we'll install one munin master for everybody in the classroom. The installation documentation on the official website is very good so we'll follow that one. The overall processes has three components.
- install munin
- configure the master to query some future nodes
- install a web server to serve the monitor pages
Installing
Installing can be done through the Debian package manager.
Do a tab-complete to see all available packages and note that on the master you need the munin package.
sudo apt install munin
It installs and configures itself as a systemd service we can start, stop or inspect with the following commands.
sudo systemctl start munin.service
sudo systemctl stop munin.service
sudo systemctl status munin.service
If you used tab-complete, as you should, you probably noticed that there are two munin services running.
munin.service is the master and munin-node.service is the node.
Why does the master also install the node?
Well, just so it can monitor itself and display it in the web gui.
This gives you already a good idea of what will need to be installed and configured on the nodes.
Configuring
The main configuration file for munin is located at /etc/munin/munin.conf.
Open up your favorite text editor and browse through it.
There is should be an entry to just one node that is your localhost.
This is the server monitoring itself.
On my demonstration server the configuration is as follows.
# a simple host tree
[muninserver.86thumbs.net]
    address 127.0.0.1
    use_node_name yes

[vps.86thumbs.net]
    address 10.8.0.1
    use_node_name yes

[bigone.86thumbs.net]
    address 10.8.0.2
    use_node_name yes

[hugeone.86thumbs.net]
    address 192.168.0.236
    use_node_name yes

[yacyone.86thumbs.net]
    address 10.8.0.4
    use_node_name yes
For now we'll just leave it as is and move on to installing the web server.
The web server
Here you have a choice to make but any way you go, you can't really go wrong.
My web server of choice is often nginx and we'll install that one together because I'm most comfortable with it.
When you install your own master maybe try out a different one.
The documentation has templates for the following we servers.
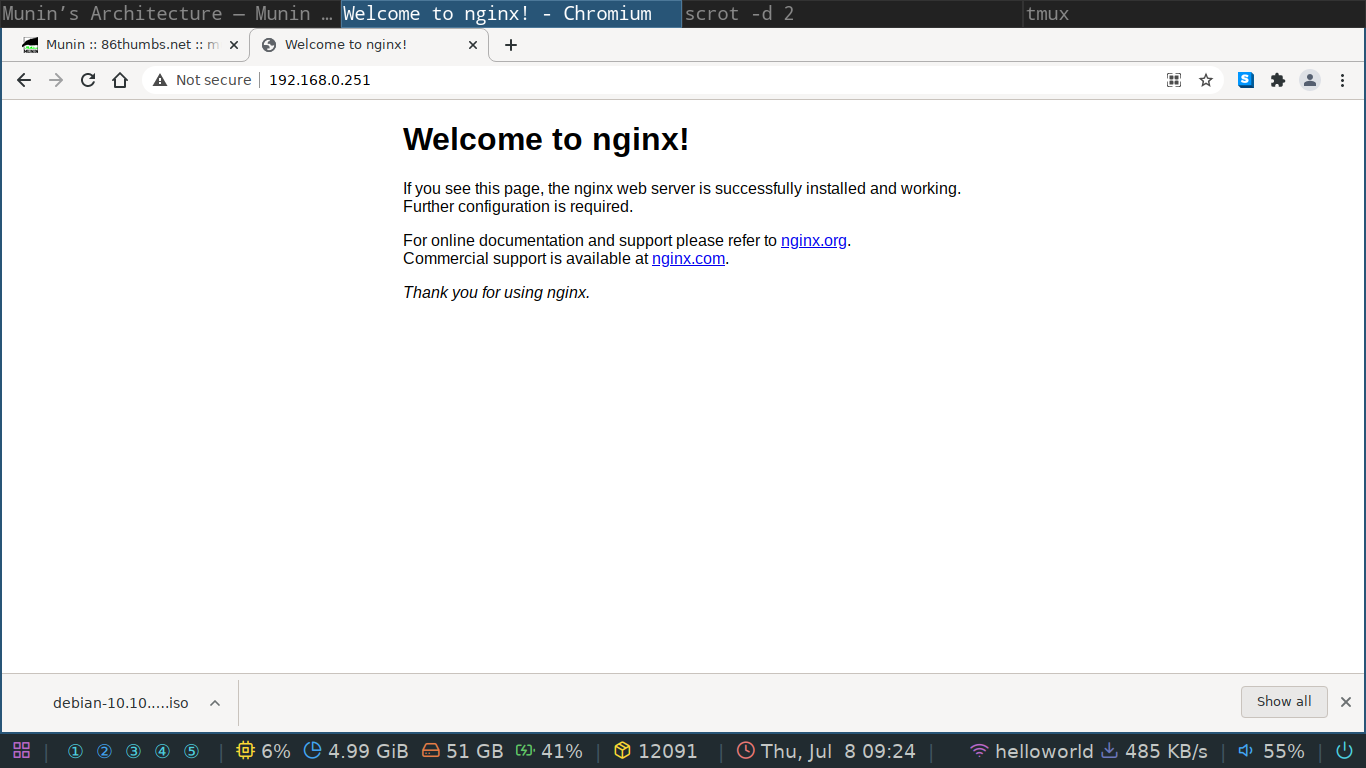
Nginx is really easy to install on Debian. Just type sudo apt install nginx and when you get your prompt back, you'll have a web server running.
To verify it's working we can use any web browser we want.
The main configuration directory for nginx can be found at /etc/nginx.
Nginx is a bit different compared to most configuration we've done up until now.
The server itself is configured via the /etc/nginx/nginx.conf file and the /etc/nginx/conf.d/ folder but the websites your server serves to the outside world are stored in /etc/nginx/sites-available and /etc/nginx/sites-enabled.
Each site should have an actual configuration file in the /etc/nginx/sites-available folder and if you want the lite to be live you should create a symbolic link to this site in the /etc/nginx/sites-enabled folder.
First have a look at the /etc/nginx/sitex-available/default file to understand how the configuration works.
Can you change something on the default webpage please?
We can add a new file in the /etc/nginx/sites-available directory called munin.
You can name this any which way you want.
For example, on my vps that runs our domain I have the following files which offer websites:
➜  sites-enabled ls -l
total 36
-rw-r--r-- 1 root root 2049 Mar 25 20:56 86thumbs.net
-rw-r--r-- 1 root root 1813 Mar 25 12:42 gitea.86thumbs.net
-rw-r--r-- 1 root root 1646 May 24 12:00 ipcdb.86thumbs.net
lrwxrwxrwx 1 root root   50 Mar  4 22:20 jitsi.86thumbs.net.conf -> /etc/nginx/sites-available/jitsi.86thumbs.net.conf
-rw-r--r-- 1 root root 1907 Mar 25 20:55 matrix.86thumbs.net
-rw-r--r-- 1 root root 1720 Jul  8 16:49 munin.86thumbs.net
-rw-r--r-- 1 root root 1758 Mar 11 16:41 radio.86thumbs.net
-rw-r--r-- 1 root root 1881 Mar 11 16:41 riot.86thumbs.net
-rw-r--r-- 1 root root 1930 Mar 11 19:07 taskjuggler.86thumbs.net
-rw-r--r-- 1 root root 2200 Jul  7 18:50 yacy.86thumbs.net
➜  sites-enabled
As you can see, I did not follow the proper rules and only one file is a symbolic link towards sites-available.
Shame on me!
The documentation gives us a good idea of how to configure the website but it's not fully complete.
The following configuration should give you a fully functional monitoring page.
server {
	listen 80;
	listen [::]:80;

	location /munin/static/ {
    		alias /etc/munin/static/;
    		expires modified +1w;
	}

	location /munin {
    		alias /var/cache/munin/www/;
    		expires modified +310s;
	}
}
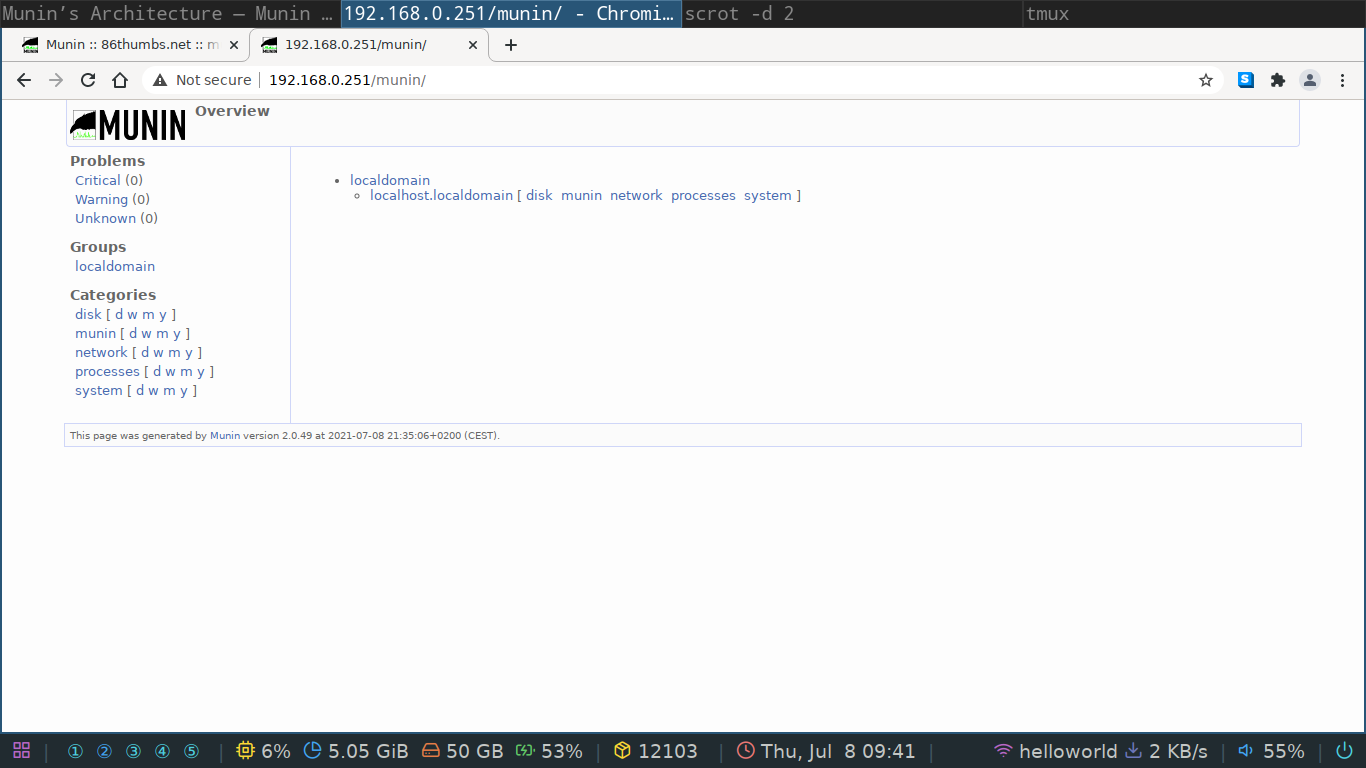
It's even more basic than the one supplied by munin itself just to illustrate a bare bones website. If you now go to the server you should see the munin monitoring page with one node available, itself.
I urge you to read up a bit on nginx configuration and to look at the folders on your system that are used by nginx to serve websites. Web servers are an essential part of any Linux system administrator's life.
Can you figure out how to password protect this folder so it behaves like my munin server?
The first node
Let's add some nodes! The nodes have to be in the same network in order to be contactable by the master. There are nifty ways to overcome this problem but that is for a later date. If you do feel like diving deeper into it, have a look here.
On any virtual machine you have around you can install the node by simply doing sudo apt install munin-node.
The node is now up, running and listening for incoming connections on port 4949 (by default).
It is however quite picky in accepting incoming connections!
The configuration file for the node is located at /etc/munin/munin-node.conf.
Open it up and have a read.
You should see two lines very similar to the one below.
allow ^127\.0\.0\.1$
allow ^::1$
Can you tell me what those are? Yes, that's a regex! By default the node only accepts incoming connections from the localhost. We can add as many masters as we like to this list but we must respect the regex syntax. I'll leave that up to you to figure out.
Plugins
Munin works with plugins to supply the master with data to plot. You can install extra plugins or even write your own in bash or in python. To have your node auto detect which plugins should be used you can execute the following command as root (not sudo).
munin-node-configure --shell --families=contrib,auto | sh -x
Other operating systems
Because the munin server client model is so basic you can find node software for most operating systems. I've run it successfully on freeNAS but you can try a windows node as well.
When I say simple I mean really simple. For those who like digging a bit deeper, you can connect to the munin node over telnet. From a terminal on the master, or any IP address that is in the allow list of the node, you can do the following.
waldek@muninserver:~$ telnet 10.8.0.1 4949
Trying 10.8.0.1...
Connected to 10.8.0.1.
Escape character is '^]'.
# munin node at vps-42975ad1.vps.ovh.net
help
# Unknown command. Try cap, list, nodes, config, fetch, version or quit
list
cpu df df_inode entropy fail2ban forks fw_conntrack fw_forwarded_local fw_packets if_err_eth0 if_err_tun0 if_eth0 if_tun0 interrupts irqstats load memory netstat ntp_kernel_err ntp_kernel_pll_freq ntp_kernel_pll_off ntp_offset open_files open_inodes proc_pri processes swap systemd-status threads uptime users vmstat
fetch cpu
user.value 21547781
nice.value 22016
system.value 8773929
idle.value 895574842
iowait.value 449848
irq.value 0
softirq.value 773399
steal.value 540782
guest.value 0
.
quit
Connection closed by foreign host.
waldek@muninserver:~$
Notes and hints
You might feel munin is too simple or basic because it does not offer any tweaking via it's web GUI but that's the main reason why I like and use it so much. Because it's so simple, it's not a real security risk. I would however not expose a master to the internet without SSL and a good htpasswd. There are some known exploits in the CGI part of munin.
- the Debian system administrator handbook has a good section on munin
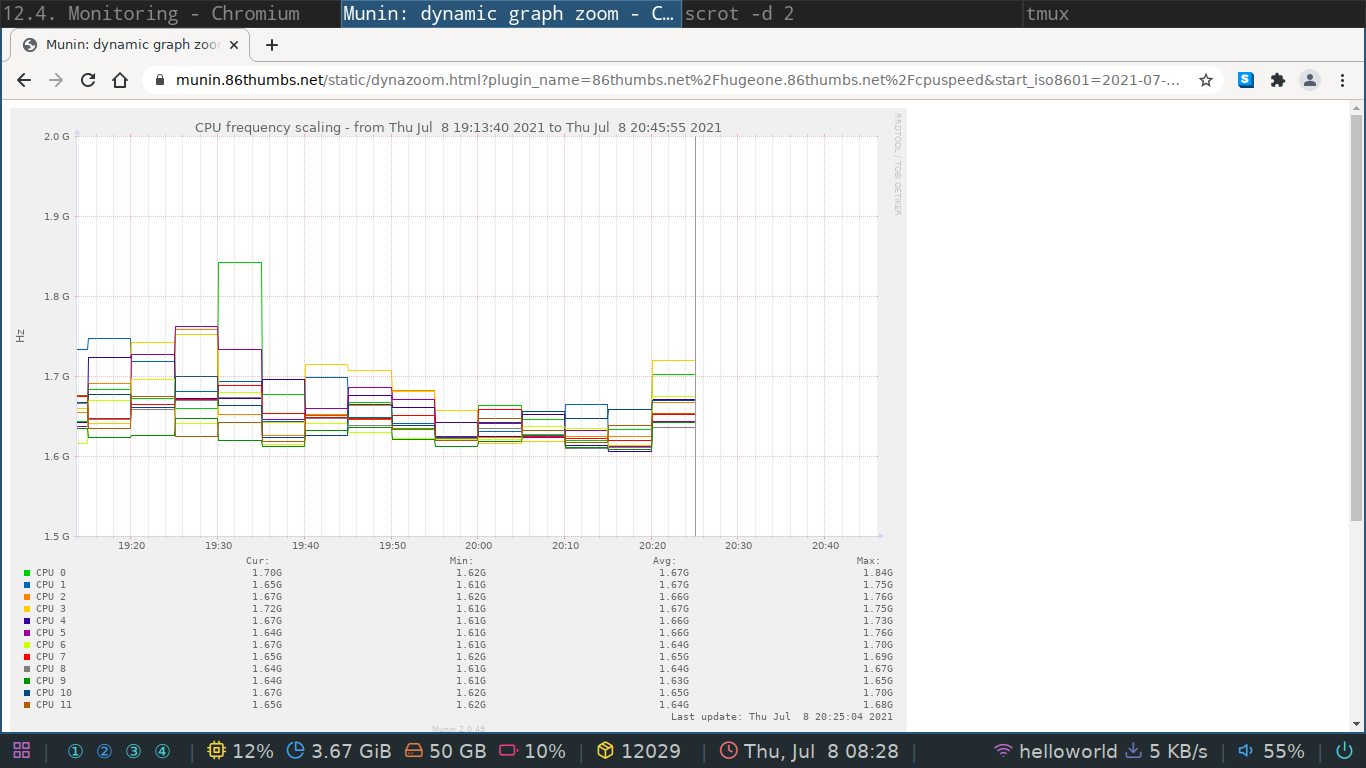
- if your dynamic zoom is not working have a look here
Alternatives
There are quite a few alternatives out there to choose from. One of the better known is nagios which can be installed on Debian as well. There are ways to have munin and nagios work together that are described here.
Cacti
Cacti is a very similar monitoring system compared to munin. Where munin shines in it's simplicity, cacti can be fine-tuned host by host, monitor even more diverse clients such as Cisco routers and switches. I personally prefer munin mostly because I know it better but let's have a go at installing cacti to see if we like it better or not!
Architecture
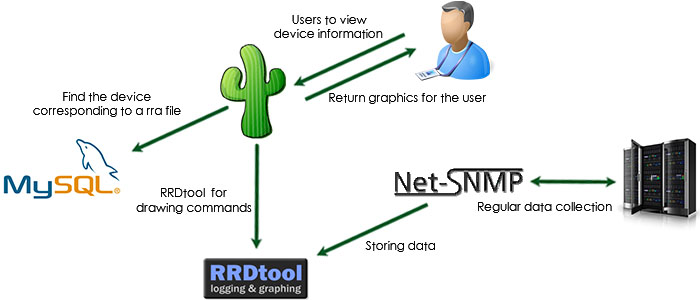
The architecture for cacti is very similar to munin and can be seen below. They serve the same purpose but do two main things differently.
- how cacti fetches the data
- how cacti stores the data
Fetching data
Munin fetches it's data via a simple telnet connection.
To restrict access it defaults to blacklisting all IP's except the ones we allow in the configuration file located at /etc/munin/munin-node.conf.
Cacti relies on the more elaborated SNMP protocol.
As it's a full blown protocol it can do a lot more than just fetch data and hence is more prone to exploits.
Storing data
Munin stores it's data as simple binary files located at /var/lib/munin/$DOMAIN_NAME.
It's not the quickest nor the most compact way of storing data but as it's not a high demand service it can get away with it.
Cacti on the other hand uses an SQL database to store it's information which is a more mature way of dealing with data availability but comes at the cost of an other server, a mysql in this case, and more configuration and potential security threats.
Installing the master
Debian has a good all-in-one package to install cacti.
It takes care of all the heavy lifting for you and will prompt you with some questions.
You install it with the good old package manager sudo apt install cacti.
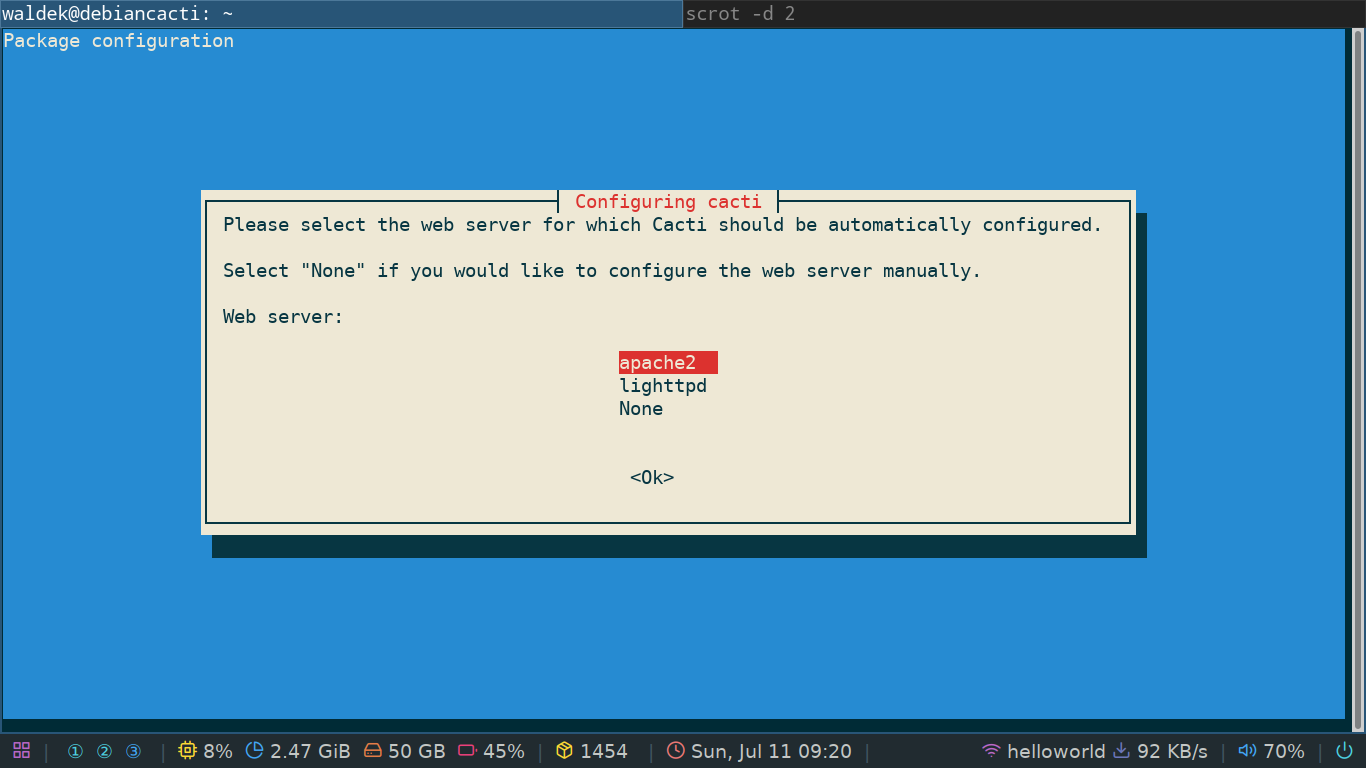
First you'll be prompted with a choice of web server to install.
You can choose any which one you like, or choose none if you want to use nginx for example.
Depending on your choice, apt will fetch the necessary packages.
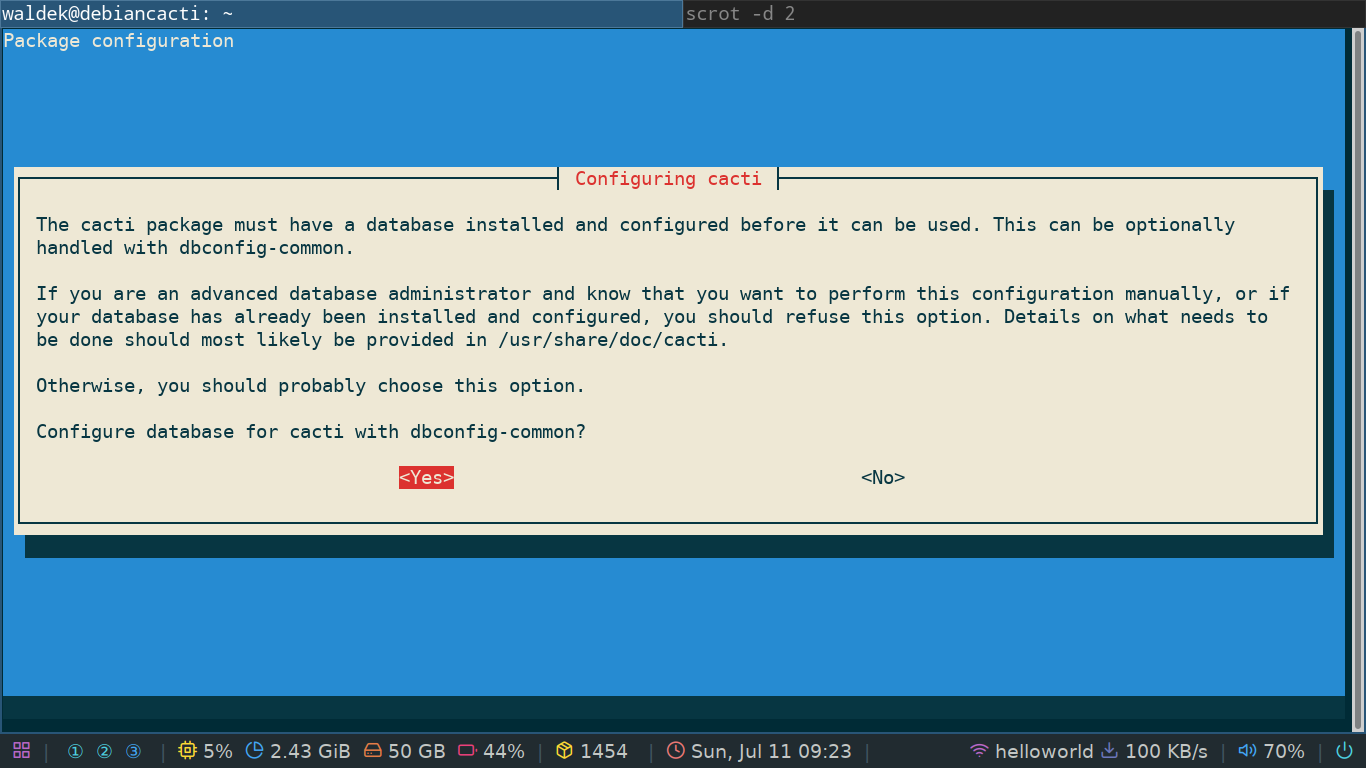
Once that's all done you'll be prompted to configure the database. Here I highly advise you to choose yes as sql databases can be a bit of a pain to set up.
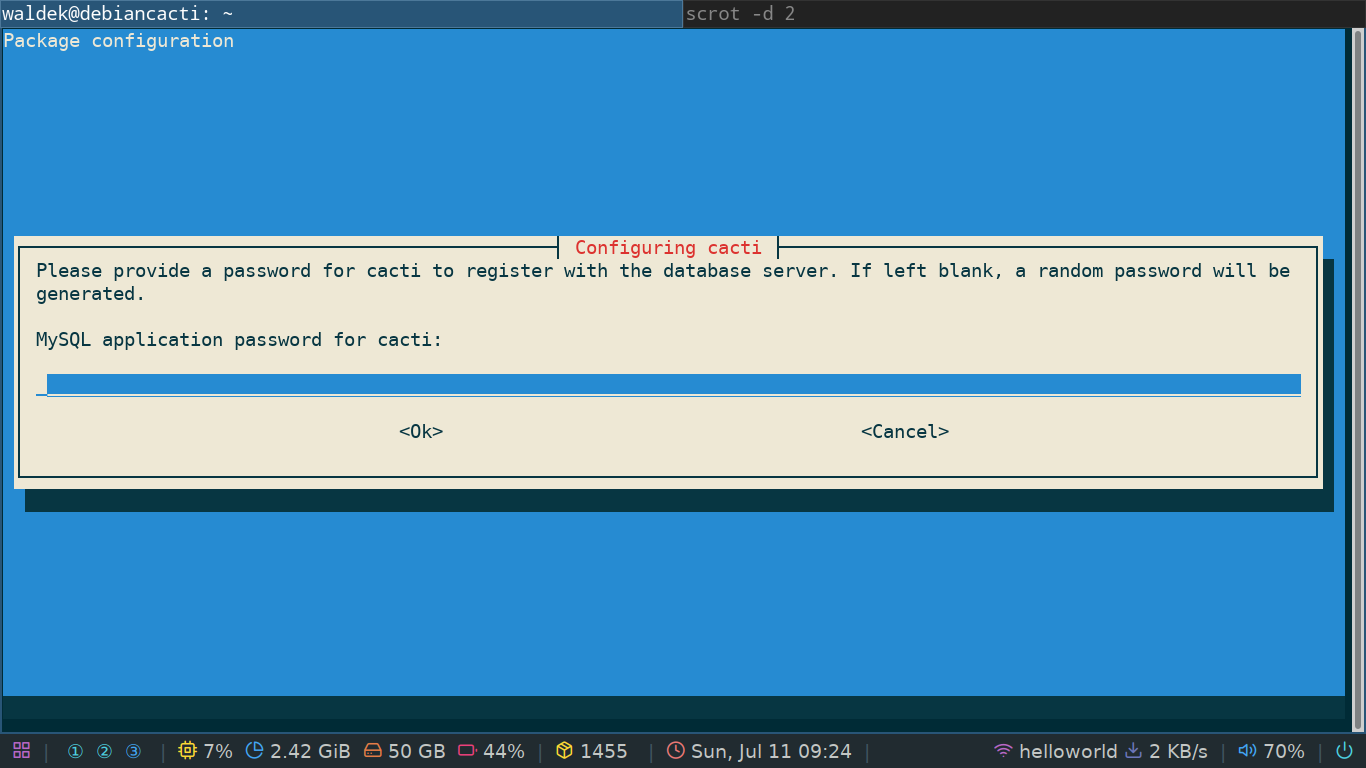
If you chose yes you'll immediately be prompted to set a password for the cacti user in the database. This will also be the admin password you'll use to log into the web GUI. For testing purposes you can choose a simple one but if you think you'll use the server for anything serious, you need a serious password!
That's it, your cacti server is now up and running!
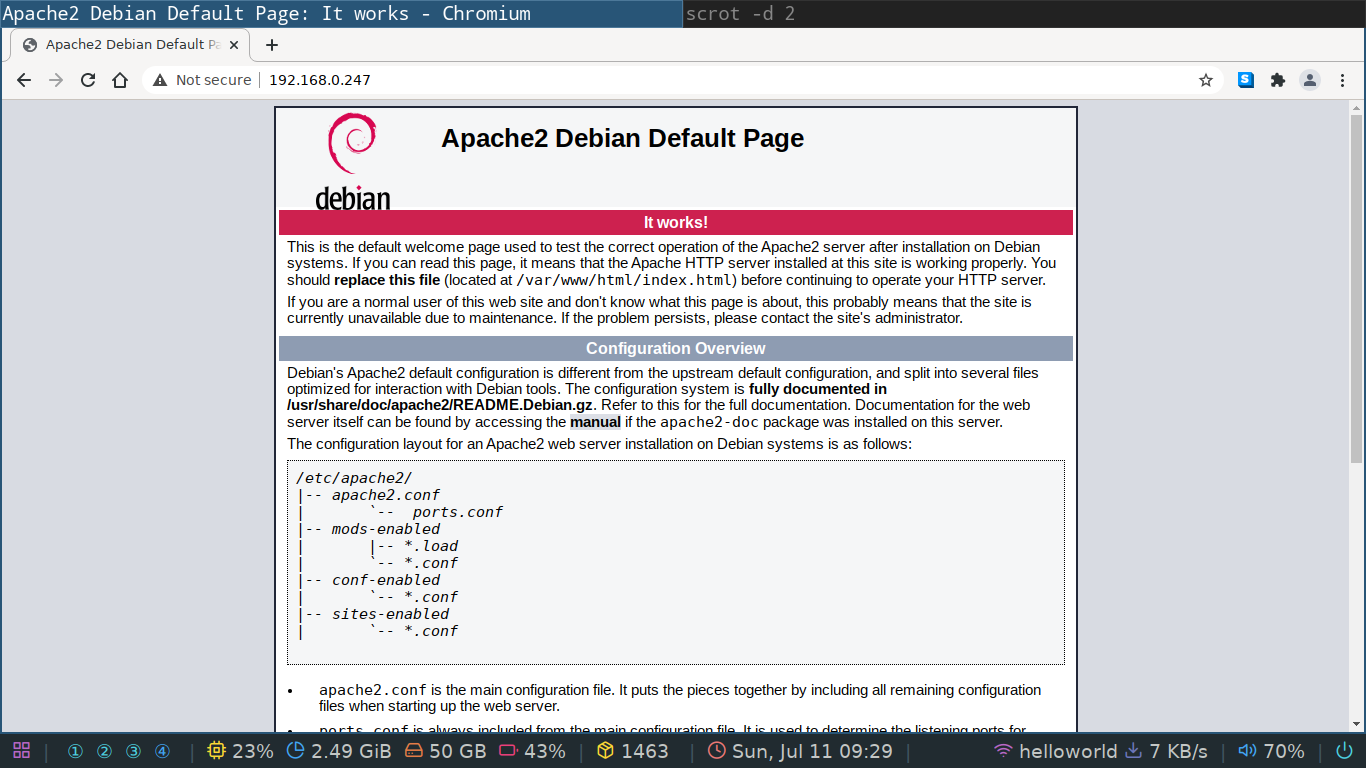
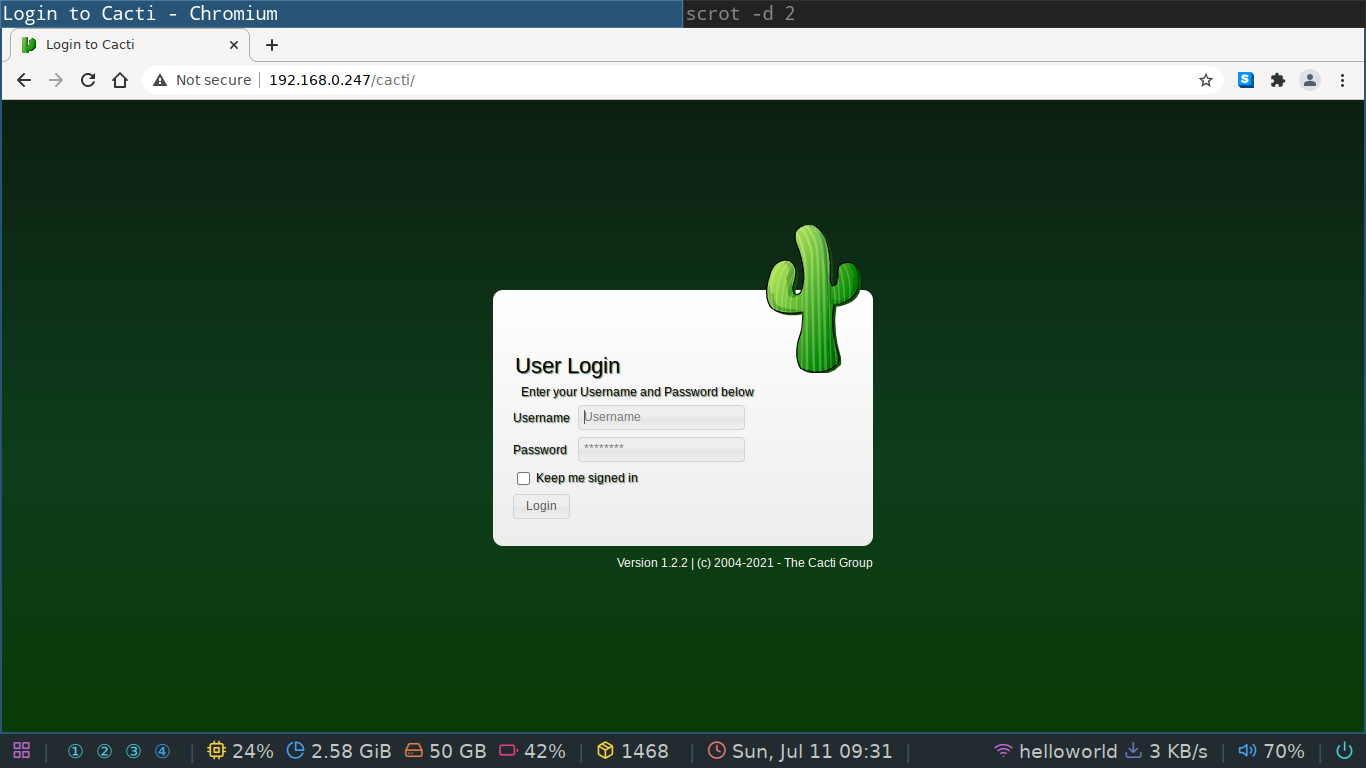
You can visit it's login page by going to the IP address of your cacti server.
If you see the default apache2 page as seen below, append /cacti after your IP.
You need to use the password you set during the installation, but the username for the default user is admin.
Configuring the nodes
Now that we have a server up and running it's time to add some clients to it. Contrary to munin, cacti does not install it's node/client component on the server in order for you to be able to monitor itself. Now, which package do we need to install on a client in order for it to be able to submit data to our server? The answer lies in the protocol used by cacti. The following command will install the SNMP daemon onto our first client, our cacti server.
sudo apt install snmpd
This is a quick install and the server should now be ready to report to itself.
Let's try to add it as a client.
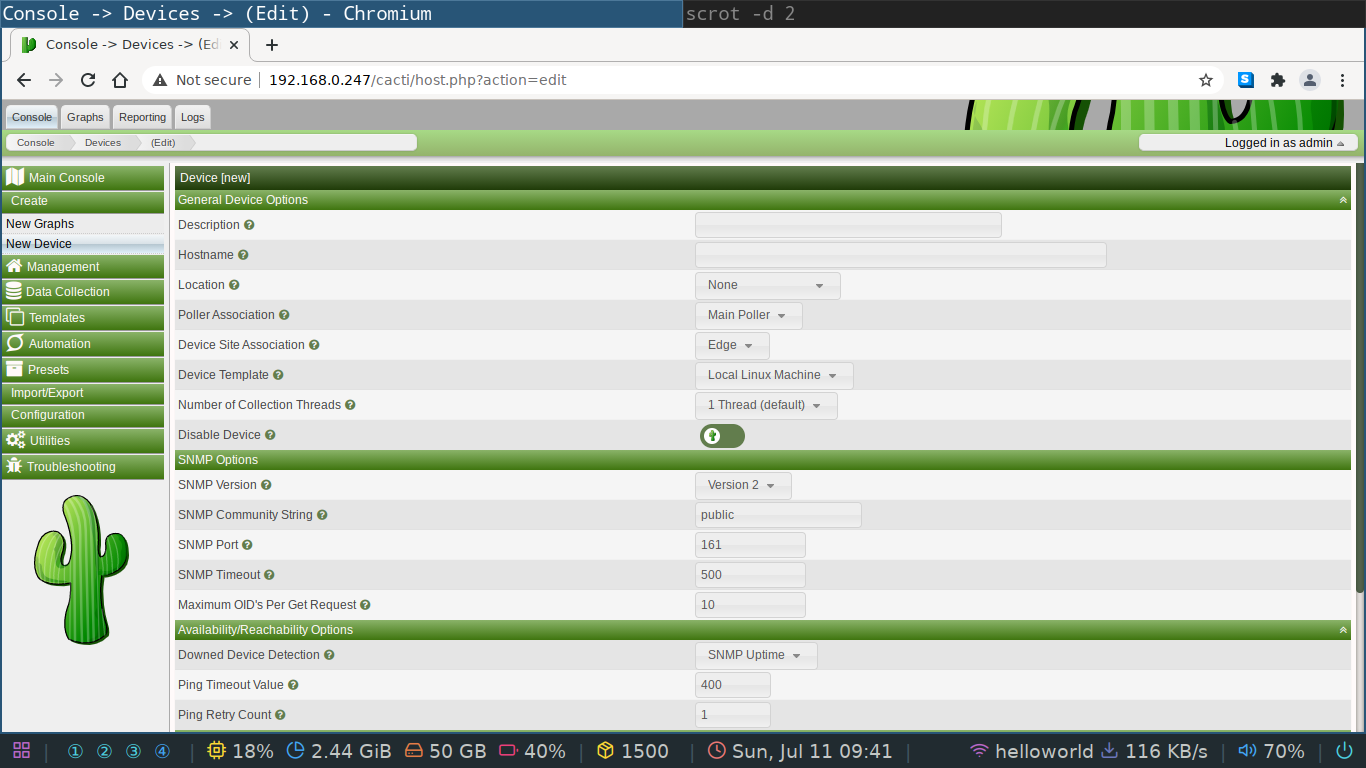
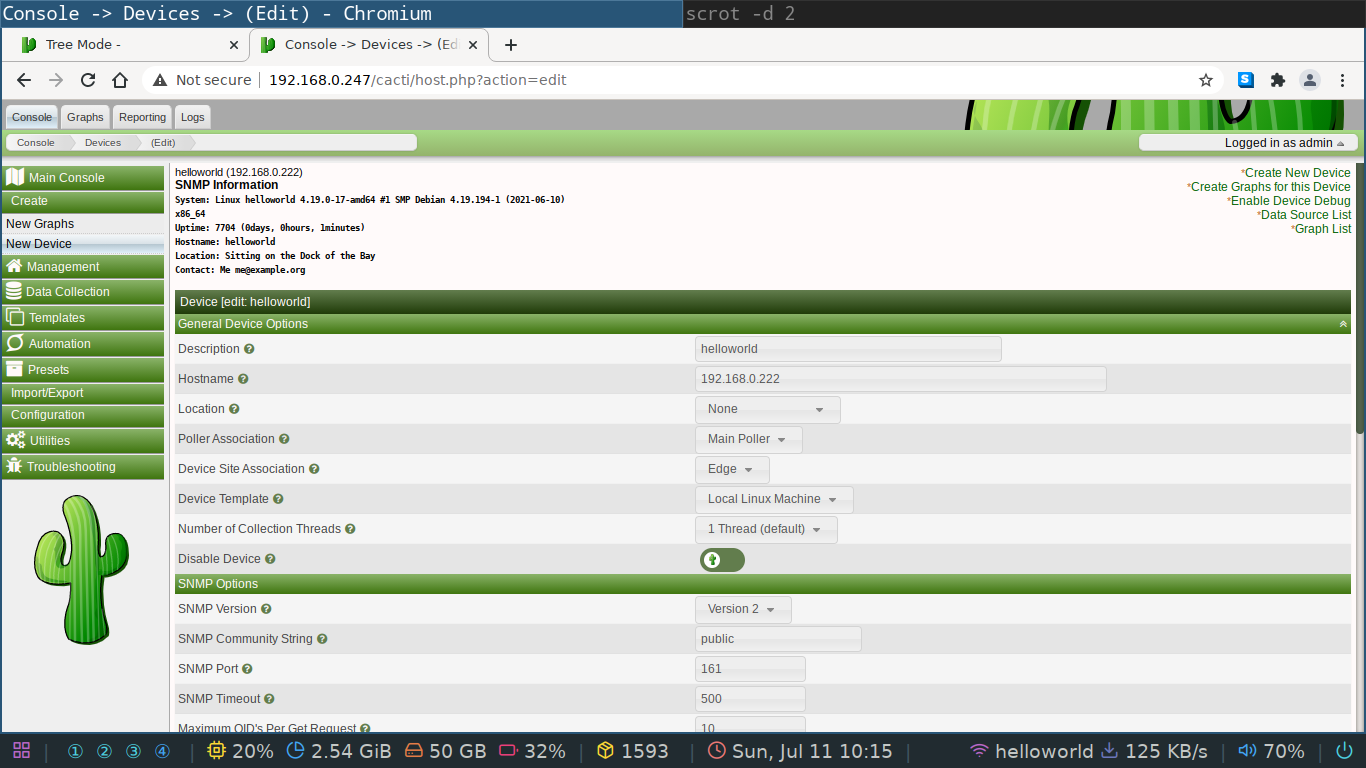
In the web GUI you need to go to the create->new device tab.
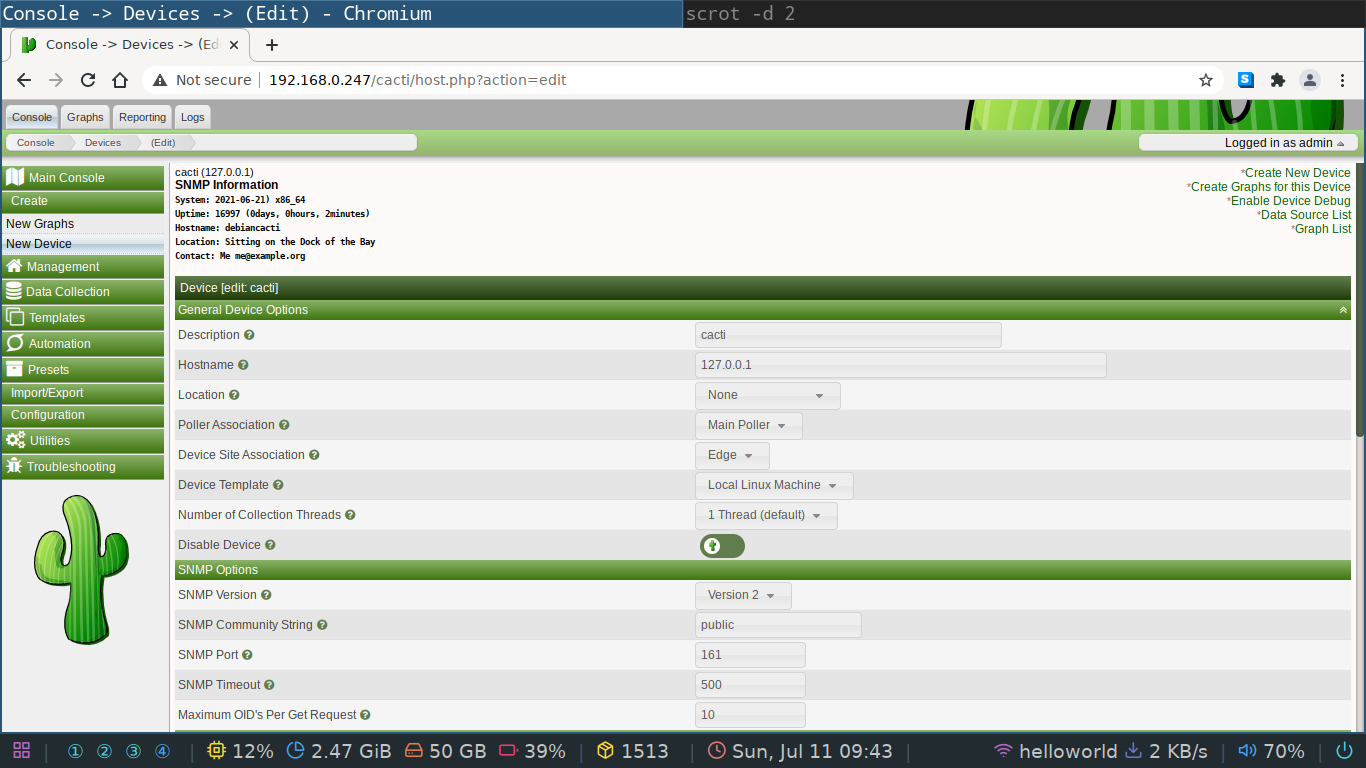
In the description you can put anything you want, but the hostname field needs to be the IP address of your server, which in our case is the loopback device 127.0.0.1.
You'll see the following screen if your device was successfully added, which should be the case if you followed the isntructions.
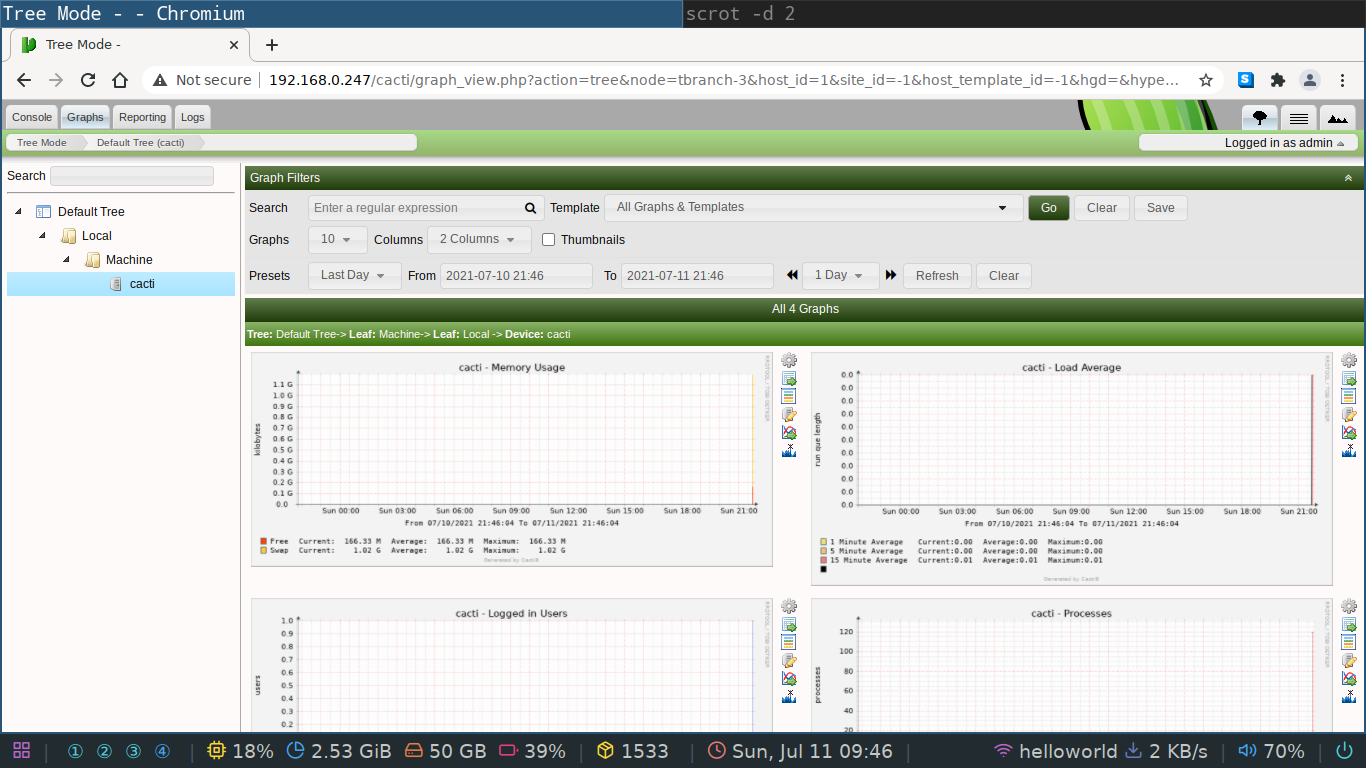
You can now inspect the data collected in the graph tab of the web GUI.
It should look similar to the screenshot below.
It's very possible that the graphs are not yet showing.
This depends a bit on whether the poller has already finished polling the SNMP daemon but this should be a one time problem fixed by waiting a couple of minutes.
The procedure above is how you add clients to the server. It's basically a two step process, but we'll see in a minute we need one extra half step to make it work with clients that are not the server itself.
- install
snmpdon the client- configure which IP the client listens on
- add the client IP to the server
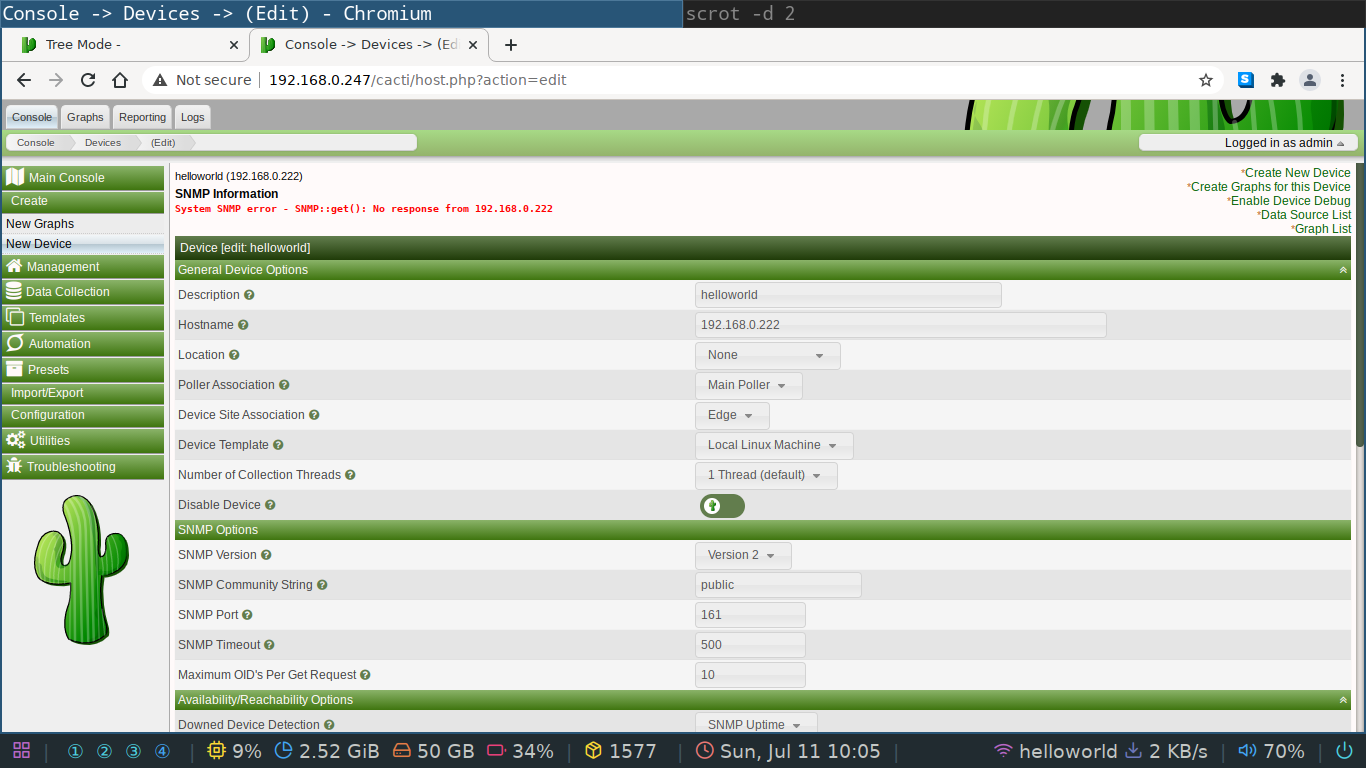
So, let's add an other client to the master. Take any Linux machine you have and install the snmpd package. Once installed try to add it's IP address to the web GUI of cacti. You'll be confronted with an error screen like the one below. The client was added but there is an error message in red. What's happening here?
System SNMP error - SNMP::get(): No response from 192.168.0.222 means that the client is not listening for incoming connections.
We can fix this by configuring the client to listen on all interfaces.
By default the SNMP daemon only listens on the loopback device but it's an easy fix.
Open the following file /etc/snmp/snmp.conf with your favorite text editor and the problem is sitting right in front of your nose.
#
#  AGENT BEHAVIOUR
#

#  Listen for connections from the local system only
agentAddress  udp:127.0.0.1:161
#  Listen for connections on all interfaces (both IPv4 *and* IPv6)
#agentAddress udp:161,udp6:[::1]:161
You should comment the active agentAddress in exchange for the second one.
The second one makes the daemon listen on all interfaces for both ipv4 and ipv6.
If for some reason you configured your Linux kernel to only do ipv4, you'll need to remove the ipv6 entry as follows agentAddress udp:161 otherwise the daemon will fail to restart.
If you restart the service with sudo systemctl restart snmpd.service you're client should be contactable by your server!
